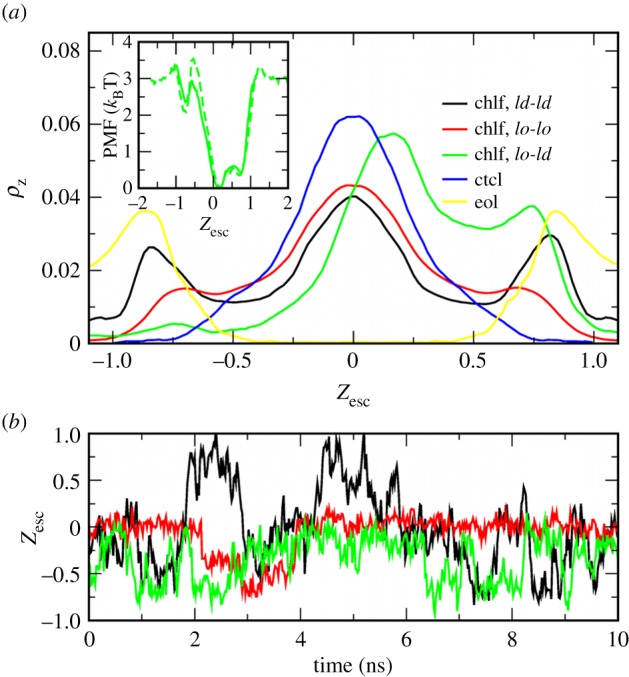
Figure 5.

(a) Chlf distribution probability in the z-axis (normal to membrane surface), ρz, for different transversal membrane patches. Profiles are computed from the chlf trajectories in the DUPC/DSPC/chol + 0.77chlf/lipid membrane at t > 4 µs (similar behaviour is found for the other two simulated membrane systems) and normalized for each transversal patch: ld–ld (black), lo–lo (red) and lo–ld (green). In blue and yellow, distribution of ctcl and eol molecules, respectively, in the DUPC/DSPC/chol membranes at t > 4 µs (in both cases, the distributions for different transversal regions are similar). The profiles are plotted in a scaled distance with respect to the bilayer centre, Zesc, where the position of the opposite phosphate beads are fixed to Zesc = ±1. The inset shows the PMF profile for chlf computed from the density distributions in lo–ld membrane regions (solid) and by means of the umbrella sampling method in a small lo–ld membrane (dashed once rescaled). (b) Examples of trajectories of single chlf molecules tracked for a short period of time in ld–ld (black), lo–lo (red) and lo–ld (green) regions. For data corresponding to the asymmetric region (lo–ld), negative values of the scaled distance correspond to the lo leaflet.
