
Figure 2.
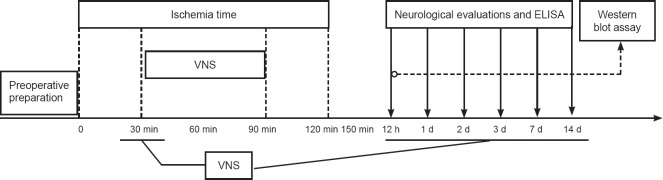
Flow chart showing the timing of vagus nerve stimulation (VNS) and subsequent evaluation and analyses.
min: Minutes; h: hours; d: day(s).
Official websites use .gov
A
.gov website belongs to an official
government organization in the United States.
Secure .gov websites use HTTPS
A lock (
) or https:// means you've safely
connected to the .gov website. Share sensitive
information only on official, secure websites.
Flow chart showing the timing of vagus nerve stimulation (VNS) and subsequent evaluation and analyses.
min: Minutes; h: hours; d: day(s).