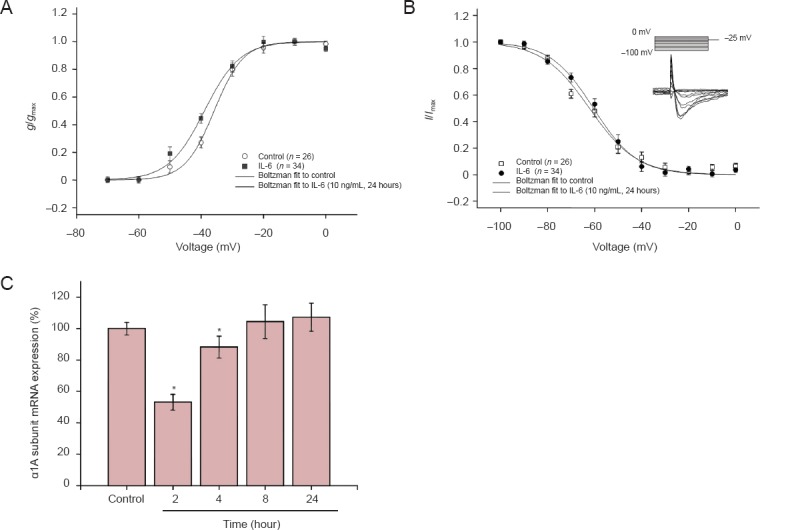
Figure 4.

Interleukin-6 (IL-6) effects on electrophysiological properties and expression of Na+ channels in cortical neurons.
(A) Voltage-dependent curve (Boltzmann equation and ignition parameters) in the 10 ng/mL IL-6 24-hour group (n = 11). (B) Inactivation characteristic curve and voltage-dependent inactivation curve (Boltzmann equation and ignition parameters) in the 10 ng/mL IL-6 24-hour group. Vertical coordinates of A and B: Standardized conductance value (g/gmax), and standardized current value (I/Imax). (C) α1A subunit mRNA expression: *P < 0.05, vs. the control group (mean ± SEM; one-way analysis of variance followed by the least significant difference test).
