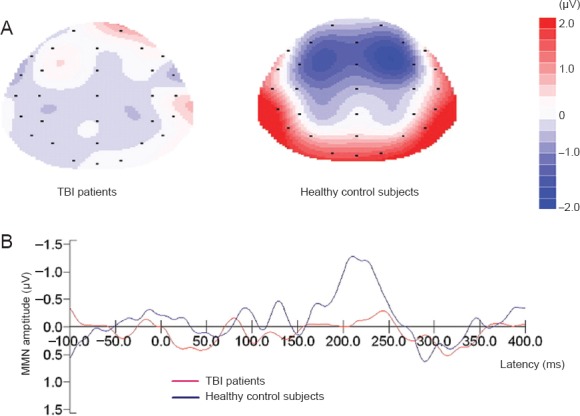
Figure 1.

Topographic maps of MMN (A) and MMN waves (B) at FCz in traumatic brain injury (TBI) patients and healthy control participants.
The MMN wave was generated by subtracting the standard event-related potential wave from the deviant ones. MMN amplitude was measured as the mean voltage between 100 ms and 300 ms. Blue region indicates low voltage and red region indicates high voltage. MMN: Mismatch negativity.
