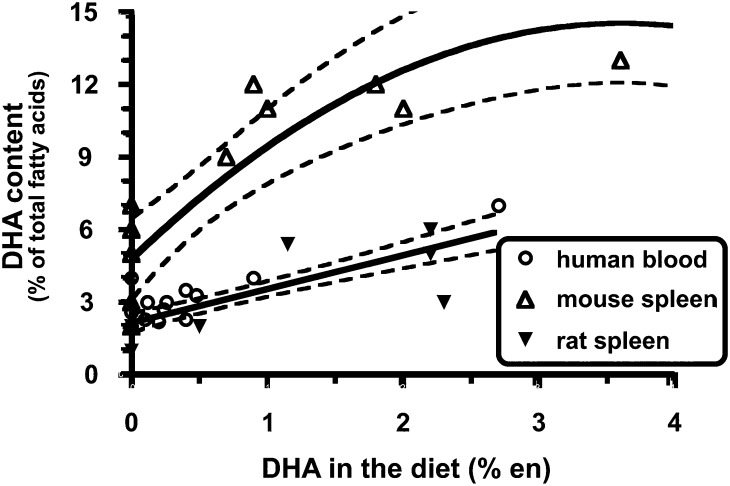
FIGURE 3.
Quantitative comparison of dietary DHA with immune cell DHA from mice, rats, and humans. The data were from studies that met the following criteria: 1) dietary n–3 PUFA (i.e., EPA and/or DHA) intake was a dependent variable in the study design, 2) the FA profile of an identifiable immune cell population was reported, and 3) data were published and identified in PubMed (National Library of Medicine) through December 2005. n–3 PUFA intake is expressed as a percentage of total energy consumed (i.e., en%). In most studies, daily caloric intake was not reported. Thus, the following assumptions were made: 1) human subjects consumed 2000 kcal/d and 2) rodents consumed the same calories across diet treatment groups. Best-fit lines/curves with 95% CI displayed by dotted lines were generated by using Prism software version 4.0b (GraphPad). Reproduced from reference 60 with permission.

