
Figure 2.
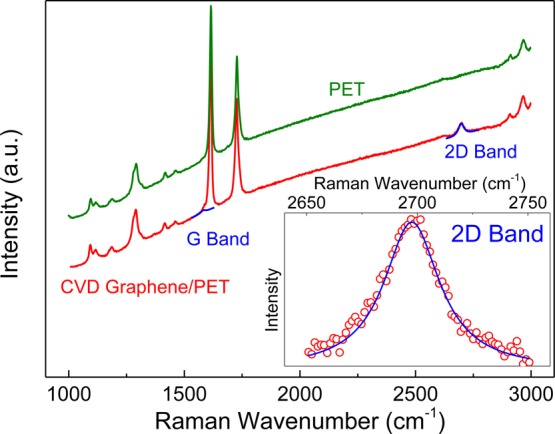
Raman spectra of the CVD graphene/PET and neat PET substrate. The background scattering was not removed from the spectra. Inset shows the experimental data (red circle) and the Lorentzian fitting (blue line) for the 2D band.
Official websites use .gov
A
.gov website belongs to an official
government organization in the United States.
Secure .gov websites use HTTPS
A lock (
) or https:// means you've safely
connected to the .gov website. Share sensitive
information only on official, secure websites.
Raman spectra of the CVD graphene/PET and neat PET substrate. The background scattering was not removed from the spectra. Inset shows the experimental data (red circle) and the Lorentzian fitting (blue line) for the 2D band.