Figure 3.

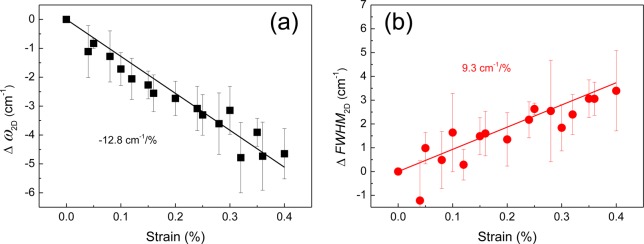
Variation of (a) ω2D and (b) FWHM2D under uniaxial strain. The solid lines are linear fits for both sets of data (mean values of eight sets of measurements).

Variation of (a) ω2D and (b) FWHM2D under uniaxial strain. The solid lines are linear fits for both sets of data (mean values of eight sets of measurements).