Figure 6.

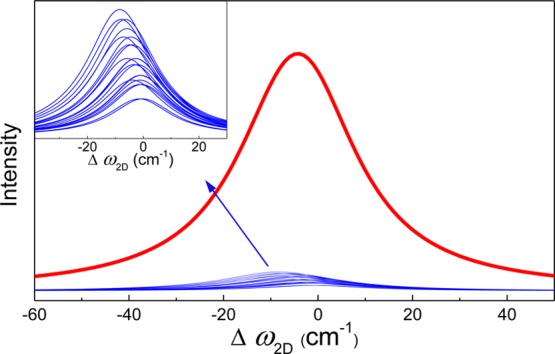
Simulated shift of Raman 2D band for each unit (1 ≤ L ≤ 6, 1 ≤ T ≤ 6, blue curves) and the integrated 2D band for the whole graphene island (red curve).

Simulated shift of Raman 2D band for each unit (1 ≤ L ≤ 6, 1 ≤ T ≤ 6, blue curves) and the integrated 2D band for the whole graphene island (red curve).