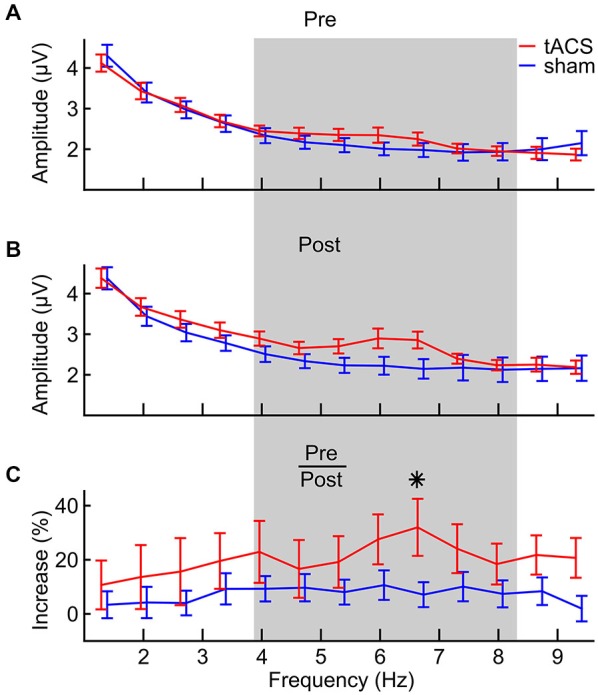
Figure 5.

FFT spectra of task-related EEG from the digit span task (A) pre-stimulation, (B) post-stimulation and (C) the relative increase from pre- to post-stimulation for both tACS (red) and sham (blue) groups. The gray area defines the frequency area of interest between 4 and 8 Hz that was statistically analyzed. Error bars denote ± one standard error of the mean. The asterisk indicates a significant (p < 0.05) difference between groups.
