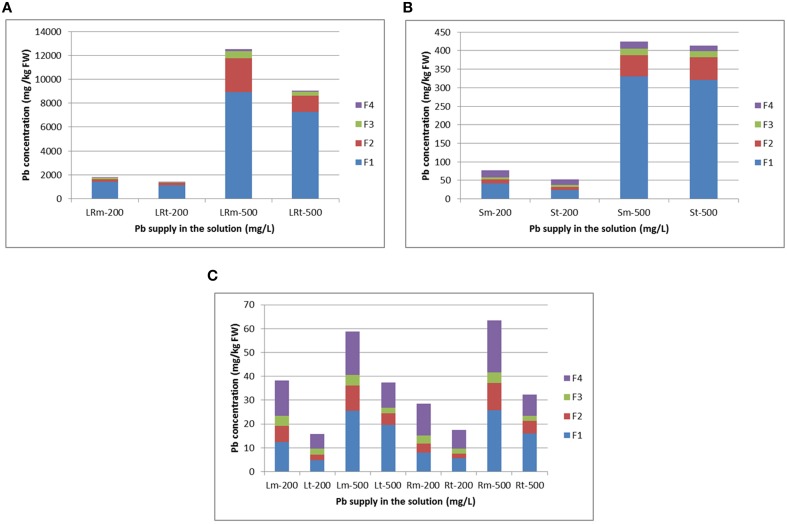
Figure 4.
Subcellular distribution of Pb and its stacking proportion in lateral roots (A), root skin (B), and leaves and roots (C) of radish. LRm-200 and LRt-200 as well as LRm-500 and LRt-500 represent lateral root treated with 200 and 500 mg/L Pb(NO3)2, respectively; Sm-200 and St-200 as well as Sm-500 and St-500 represent root skin treated with 200 and 500 mg/L Pb(NO3)2, respectively. Lm-200 and Lt-200 as well as Rm-200 and Rt-200 represent leave and root flesh treated with 200 mg/L Pb(NO3)2, respectively; Lm-500 and Lt-500 as well as Rm-500 and Rt-500 represent leaves and roots treated with 500 mg/L Pb(NO3)2, respectively. F1, F2, F3, and F4 represent the fraction of cell wall, nucleus and chloroplasts, mitochondria, and soluble components containing ribosomes, respectively. All abbreviations ending with “m” refer to NAU-XLM and “t” to NAU-XHT, “R” to root, and “LR” to lateral root, “S” to skin and “L” to leaf.

