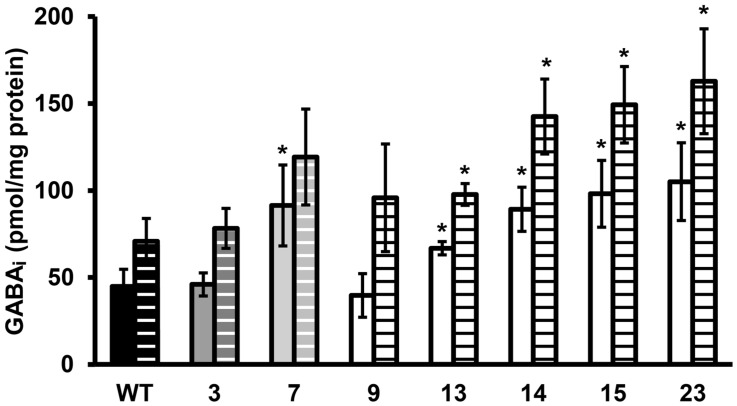
FIGURE 3.
GABAi concentration of stationary phase cells exposed to pH 4.0 in BHI for 60 min. Solid bars are the GABAi concentrations at t = 0 and dashed bars at t = 60 min. GABAi concentrations are corrected for total amount of protein. Error bars include the SD of the GABA and protein measurements and significant differences from the WT are indicated with ∗(p < 0.05).

