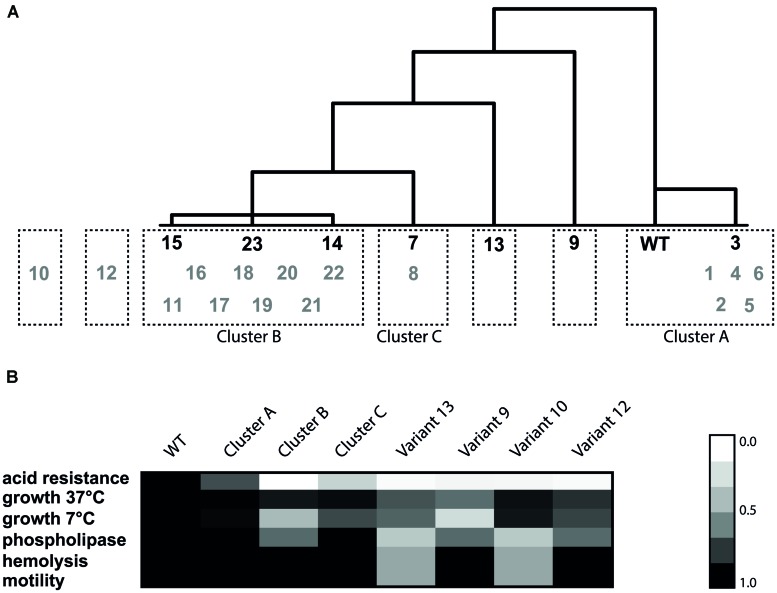
FIGURE 5.
Hierarchical cluster analysis based on Euclidean distance of the phenotypes (A) and heat map of the six phenotypes for each cluster (B). The variants in black were the initial selection for cluster analysis and the gray variants were used to validate the resulting clusters. The heat map was made by taking the average of each phenotype within one cluster. Subsequently, the relative ratio of the cluster to the WT was calculated for each phenotype.

