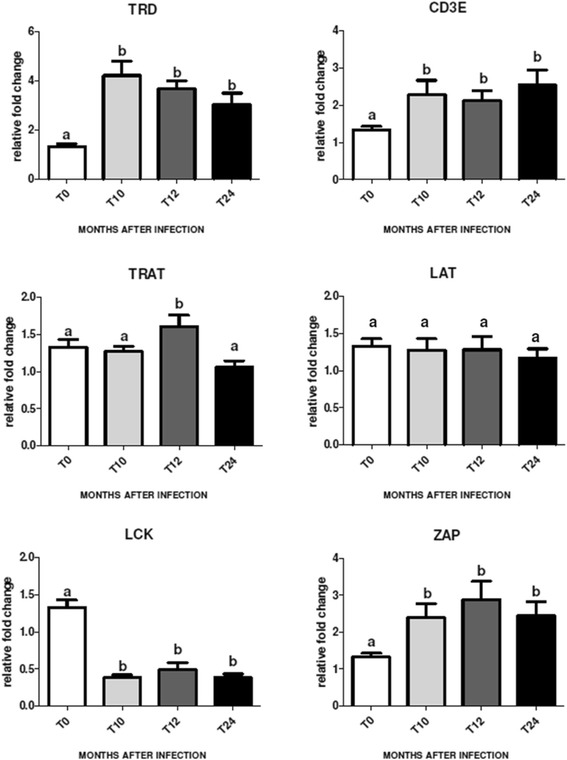
Figure 1.

Kinetics of expression for genes involved in the TCR pathway. Results from qPCR analysis of the expression of six genes (TRD, CD3E, TRAT, LAT, LCK, ZAP70) involved in TCR signaling in circulating immune cells, in control animals (T0) and BASE challenged animals at 10-12-24 months post challenge (T10, T12 and T14 respectively). Each column represents the mean ± SEM of at least three separate measurements on 4 individuals. The expression of mRNA normalized to two endogenous reference genes (β-Actin and β-2 Microglobulin), was analyzed by RT-PCR using specific primers as described in Material and Methods. The different superscripts indicate significant difference between columns (p < 0.01).
