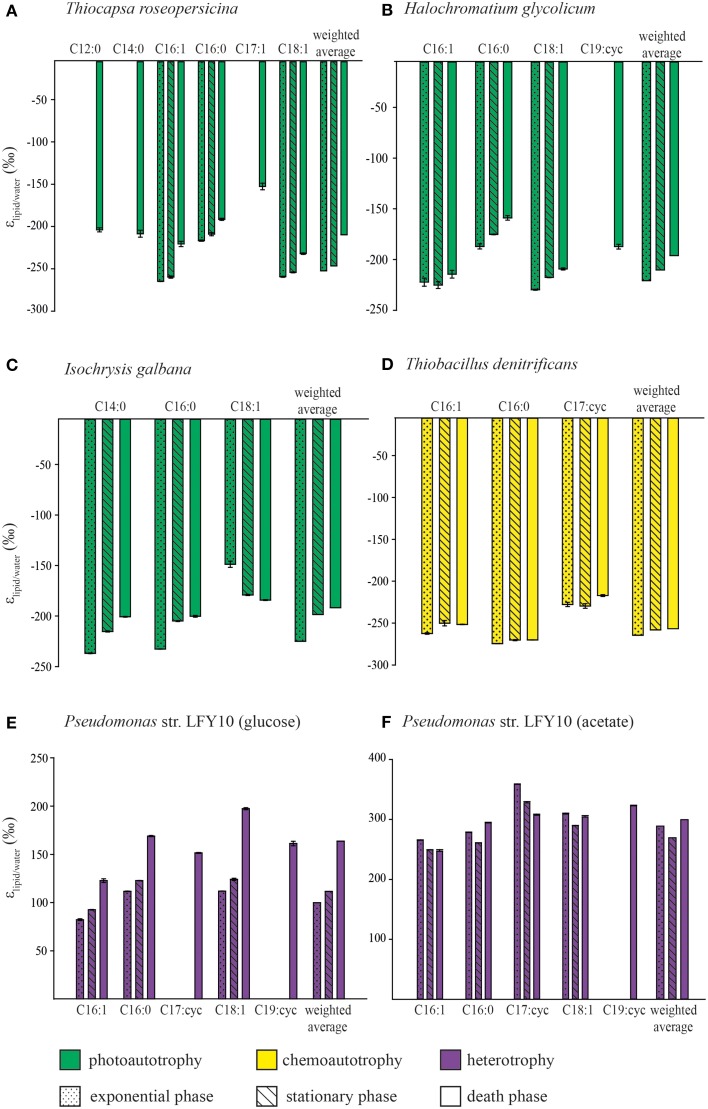
Figure 1.
The D/H fractionation between fatty acids and culture medium observed in different growth phases during the culture experiments. Plotted are the mean ε-values (lipid vs. water). Error bars are the standard deviation of the duplicate measurements of the fatty acids. (A) Thiocapsa roseopersicina, (B) Halochromatium glycolicum, (C) Isochrysis galbana, (D) Thiobacillus denitrificans and Pseudomonas str. LFY10 grown on (E) glucose and (F) acetate. Also plotted is the weighted average εlipid/water of the fatty acids.

