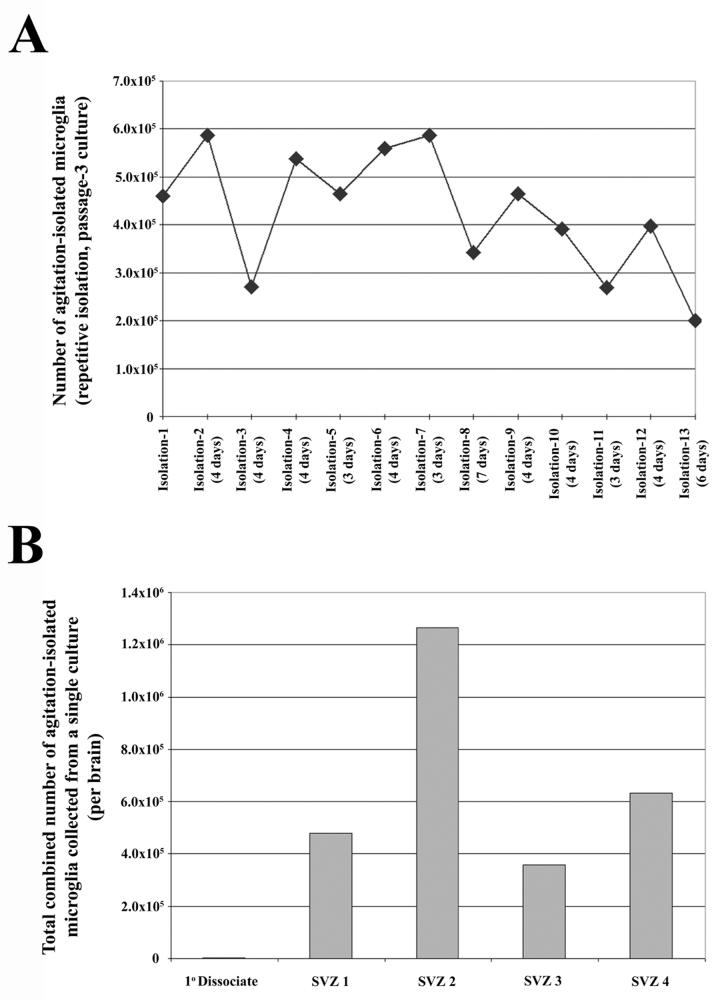
Fig. 3.
Large scale, repeatable isolation of microglia from SVZ cultures grown in MPM. (A) Time-line depicting the number of microglia isolated at each isolation from a single representative culture (passage-3). In this particular example, 13 isolations were performed over the course of 50 days (days between isolations listed with isolation number). (B) Graphical representation of the cumulative microglial yields from 4 single established cultures derived from the SVZ dissected from 4 independent brains compared to the initial number of microglia in a single primary dissociate. Each cumulative value is presented as the number of microglia per neonatal SVZ dissociate. The average cumulative number of microglia isolated per brain was 684,000 which, when compared to the initial microglial population in primary cultures (400 cells), represents a 1700 fold increase.

