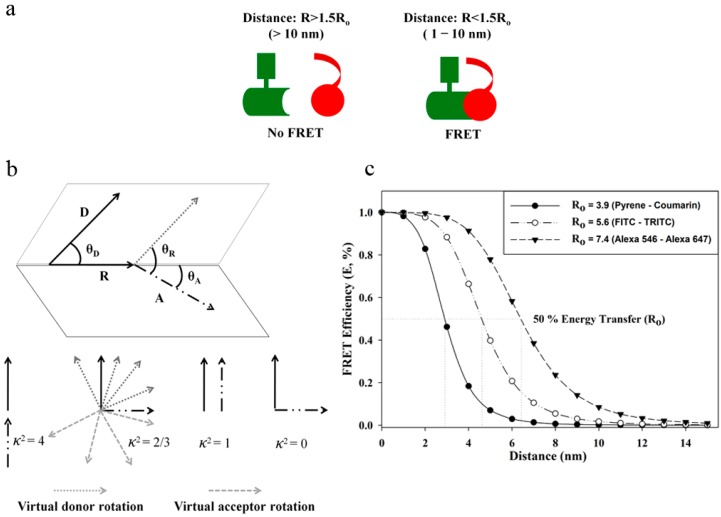
Figure 2.
(a) A schematic representation of FRET between two molecules; (b) The orientation of emission dipole moment of donor and absorption dipole moment of acceptor is illustrated in this figure. “R” is the distance between the centers of donor and acceptor. θD is the angle between the transition dipole moment of donor and the line joining the two dyes while for the acceptor this angle is indicated as θA. The angle between the donor and acceptor dipole moments is θR. The possible virtual donor and acceptor fluorophore orientations are also presented in this figure, however, in reality the vectors are not exactly as depicted rather are random and can point in any direction of space; (c) Dependence of energy transfer on distance: A graph is presented here showing FRET efficiency (E) for three FRET-pairs with R0 values 3.9 nm (pyrene and coumarin), 5.6 nm (fluorescein isothiocyanate (FITC) and tetramethylrhodamine (TRITC)), and 7.4 nm (Alexa Fluor 546 (Alexa 546) and Alexa Fluor 647 (Alexa 647)) [18]. It is obvious that with the increase in R0, the sharp rise or fall of the graph at the end of the curves is reduced, allowing the feasibility to monitor changes in “E” at that range.

