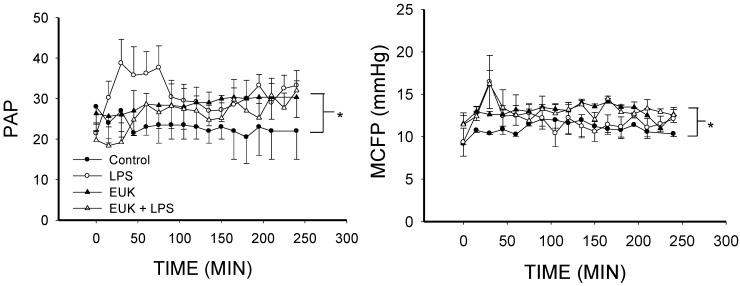
Figure 3.
Pulmonary artery pressure (PAP) and mean circulatory filling pressure (MCFP) over time for the four conditions (mean ± SEM). Left, PAP in the LPS group was higher than control (p < 0.001). LPS plus EUK-134 (p < 0.001) and EUK alone (p < 0.02) were higher than the control but were not significantly different from each other. LPS plus EUK-134 was lower than LPS alone; Right, MCFP in LPS was not different from control although there appeared to be a “spike” in the pressure that was also seen with LPS plus EUK-134 and had the same timing as the rise in PAP. MCFP was greater in the EUK-134 alone group than in the control (p < 0.003) and LPS plus EUK-134 (p < 0.003). MCFP of the LPS plus EUK-134 group was greater than that of LPS (p < 0.014). * p < 0.02, 0.005 or 0.001.

