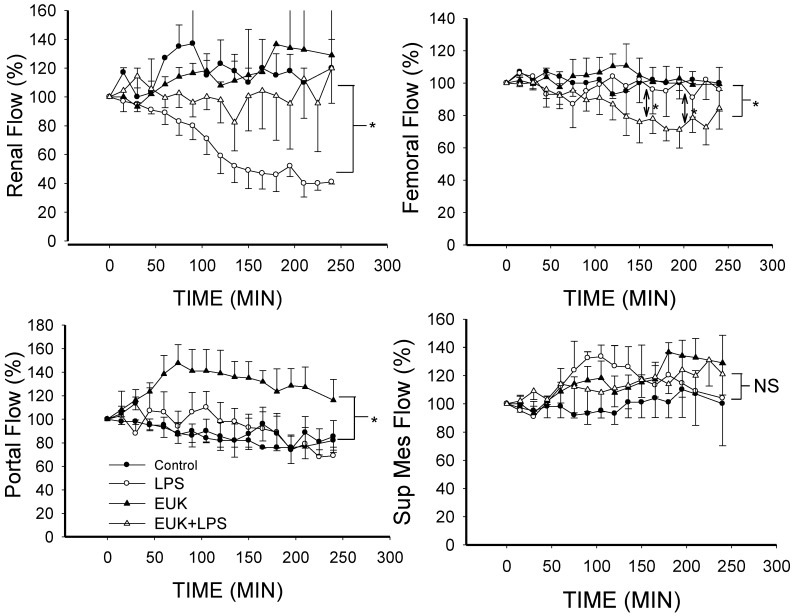
Figure 5.
Mean blood flows in different vascular beds as a percent of baseline over time for the four conditions (mean ± SEM). Upper left, renal arterial flow; Renal artery flow was lower in the LPS group than the other three groups (p < 0.001 for each condition); Lower left, portal venous flow; Portal flow was higher in the EUK-134 alone group than in the other three conditions (p < 0.001); Upper right, femoral arterial flow; Femoral flow in the LPS plus EUK-134 group was lower than the other three groups (p < 0.001); and Lower right, superior mesenteric flow; There was no difference among the four conditions. * p < 0.001; NS: not statistically significant.

