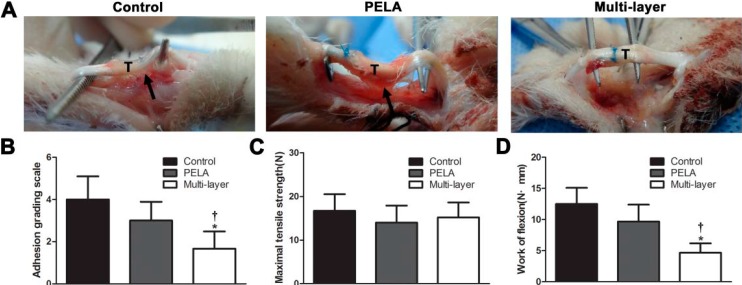
Figure 2.
(A) Gross evaluation of the rabbit flexor digitorum profundus (FDP) tendon model in the untreated control group, PELA membrane group, and multi-layer membrane group. Tendon (T) is indicated in the figures and adhesion tissue is pointed to using black arrows. Tendon repair and peritendinous adhesions are evaluated by determining macroscopic evaluation of tendon adhesions (B), maximum tensile strength (C), and work of flexion (D). * p < 0.05 compared with control group; † p < 0.05 compared with PELA membrane group. Data are expressed as mean ± SEM for six tendons/group.

