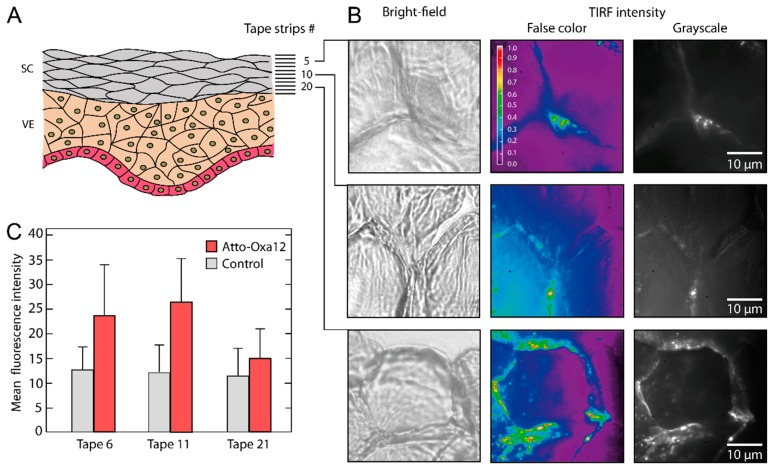
Figure 3.
(A) Schematic of stratum corneum (SC) and viable epidermis (VE) with indicated tape strip numbers; (B) False color coded images representing the relative fluorescence intensity and grayscale TIRFM images of tape 5, 10, and 20 are shown together with the corresponding bright-field microscopy images; (C) Mean fluorescence intensity as obtained from tapes 6, 11, and 21 with conventional fluorescence microscopy.

