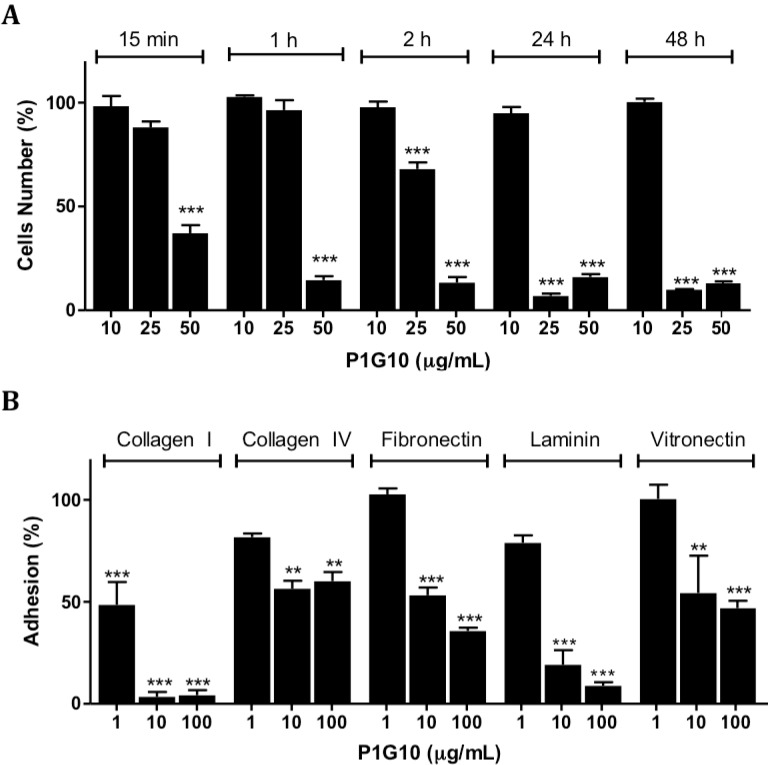
Figure 6.
Cell adhesion analysis. (A) Cells were exposed to P1G10 (1–100 µg/mL) during various intervals up to 48 h. The absorbance was measured at 570/600 nm; and (B) Treated cells were plated on wells coated with extracellular matrix components. After 1 h incubation adhered cells were stained and scored at 540 nm. Data are shown as mean ± SD. For details see the Method Section. ** p < 0.01; *** p < 0.001, ANOVA, Bonferroni’s post-test.

