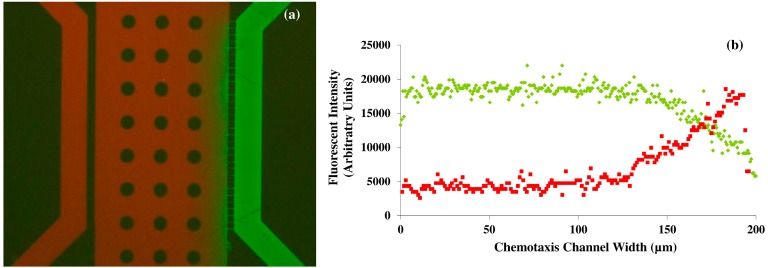
Figure 1.
Diffusion assay microfluidic device characterization. (a) Representative overlaid fluorescent image showing the concentration gradient of fluorescein and Texas Red dyes; (b) Diagram showing the averaged pixel intensity of the dyes across the center channels width. Both dyes were flowed through the device at rates of 30 μL/h. Reproduced from [14] with permission from the Royal Society of Chemistry.

