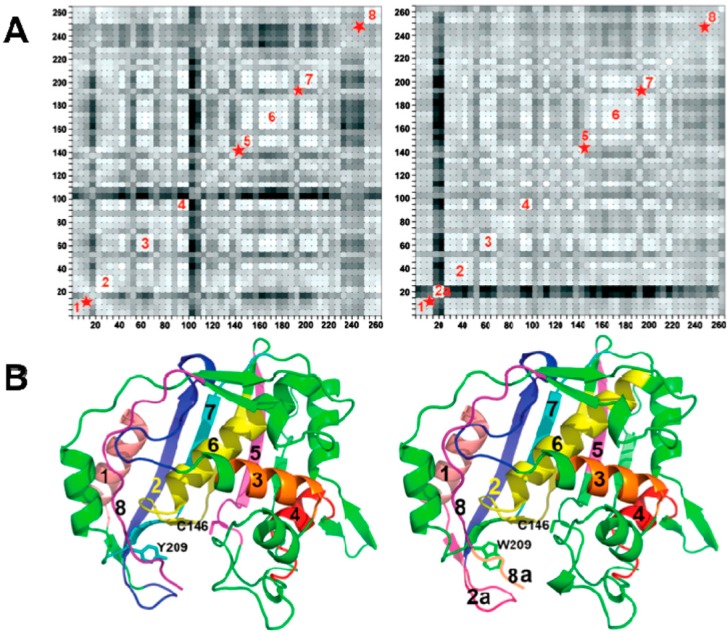
Figure 2.
(A) The residue-based matrix plots showing correlations of anisotropic B-factor displacements for Escherichia coli TSase(ecTSase) atom pairs identified by the (x,y) grid coordinates of the plot. The left plot is for the WT ecTSase and the right plot is for Y209W ecTSase (Reproduced from [14] with permission from the American Chemical Society (ACS)). The degree of correlation is represented by color-coding, where the lighter shades of grey indicate greater correlation. The blocks of light-colored squares along the diagonals of the plots indicate the protein residues that vibrate as rigid bodies. The red stars indicate segments with disrupted rigid body vibrations of the Y209W mutation. Segment 2A in the right plot is the phosphate-binding loop with relatively higher B factors; (B) Ribbon diagrams of WT (left) and Y209W (right). The segments labeled in (A) are colored. The cofactor analog (CB3717), dUMP and the mutated residue and catalytic cysteine are shown as sticks. Segment 8A represents the C-terminal. (adapted from [15] with permission from the ACS).

