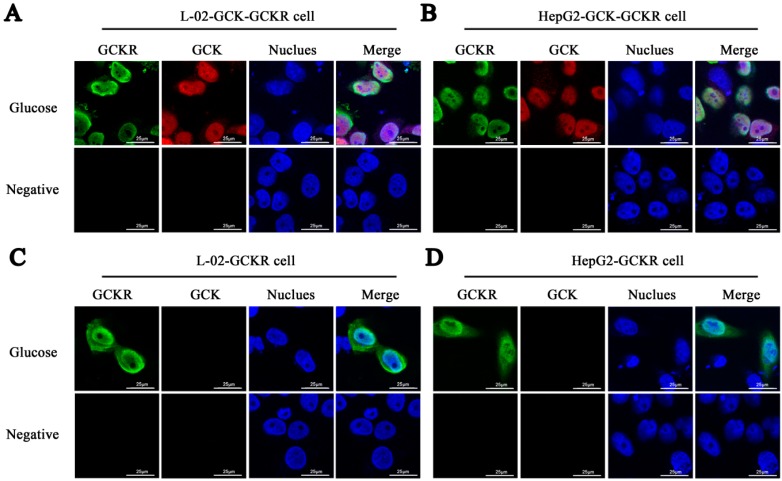
Figure 2.
Sub-cellular localization of GCK and GCKR in liver L-02 and HepG2 cells in glucose containing media. GCK and/or GCKR expressing plasmids were transfected into liver cell lines. Forty-eight hours after transfection, culture medium was changed to low glucose (5.5 mM glucose). Confocal immunofluoresence micrographs are shown for cells after culturing in low glucose for 2 h. (A) L-02 cells co-transfected with GCK and GCKR plasmids; (B) HepG2 cells co-transfected with GCK and GCKR plasmids; (C) L-02 cells transfected with GCKR plasmids; (D) HepG2 cells transfected with GCKR plasmids; (E) L-02 cells transfected with GCK plasmids; and (F) HepG2 cells transfected with GCK plasmids. GCKR (revealed in green) and GCK (revealed in red) were detected using antibodies, and the nuclei were counterstained with Hoechst (stained in blue). The overlap of the three channels is shown as Merge. White color in the merged panels in (A) and (B) denotes co-localization of GCKR and GCK in the nucleus. Cells incubated with only secondary antibodies were used as negative controls. Images are representative of four experiments with similar results. Scale bar = 25 μm.


