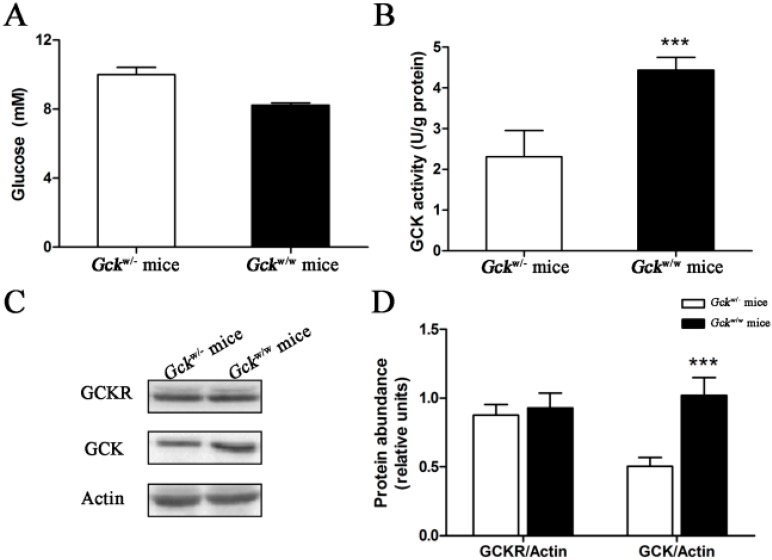
Figure 6.
Enzymatic and protein levels for glucokinase in the liver-specific Gck gene knockout (Gckw/−) mice. Ad libitum fed mice had free access to food and water. (A) Serum glucose concentrations; (B) GCK activity in the liver; (C) Representative Western blots for GCK and GCKR, with β-actin as a loading control; and (D) quantification of the immunoblots of glucokinase and GCKR are shown for Gckw/− and Gckw/w mice in the ad libitum fed state Relative units for GCK and GCKR protein abundance in (D) are the abundance of GCK or GCKR normalized to the β-actin level of that sample. *** p < 0.001 vs. Gckw/− mice. Data are presented as means ± S.D. (n = 4).

