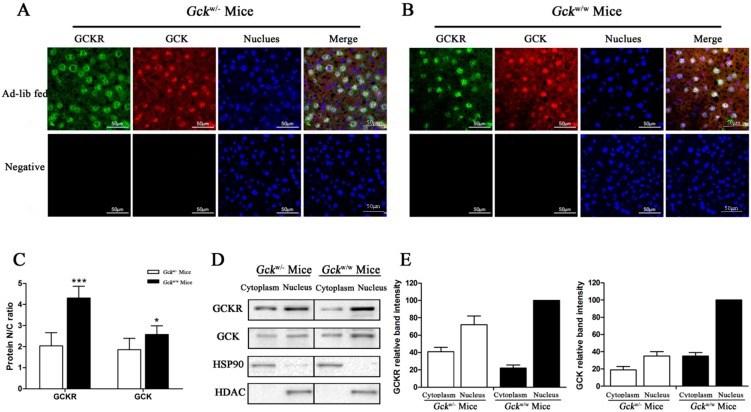
Figure 7.
Sub-cellular localization of GCKR in the liver-specific Gck gene knockout (Gckw/−) mice. (A,B) Confocal immunofluoresence micrographs with antibodies against GCKR (revealed in green), GCK (revealed in red) with the nuclei counterstained with Hoechst (stained in blue) in (Gckw/−) (A) and wild-type (Gckw/w) (B) mice. Overlap of the three channels is shown in Merge. White color in the merged panels denotes co-localization of GCKR and GCK in the nucleus. Slides incubated with only the secondary antibodies were used as negative controls. Images are representative of four experiments with similar results. Scale bar = 50 μm; (C) Nuclear/cytoplasmic ratios (N/C ratio) for GCKR and GCK are based on the immunoflouresence. Data are presented as means ± S.D. from four individual hepatocyte preparations with 30 cells in total. * p < 0.05, *** p < 0.001 vs. Gckw/− mice; (D) Representative Western blots for GCKR and GCK protein in the cytosolic (C) and nuclear (N) fractions. Cytosolic and nuclear fractions are normalized for comparable amounts of protein. Hsp90 and HDAC were used as cytoplasmic and nuclear fraction markers, respectively; (E) Densitometry analysis of the immunoblot is shown in (D). Relative band intensity of the proteins in the nuclear fraction of the ad libitum fed wild-type mice is set as 100. Data are representative of four experiments with similar results.

