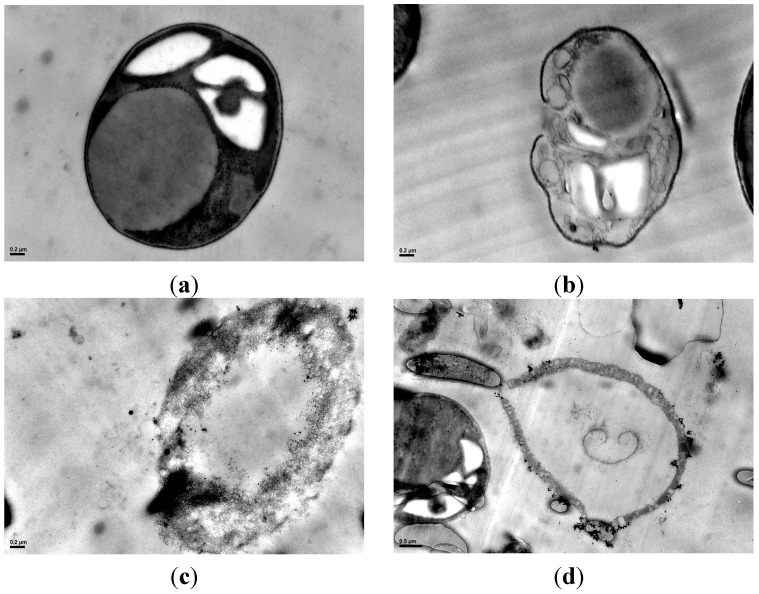
Figure 6.
Transmission electron microscopy (TEM) images of algae cell before and after disruption. (a) TEM image of an intact cell of Neochloris oleoabundans (40,000×); (b) TEM image of an algal cell disrupted with ultrasonic wave (40,000×); (c) TEM image of an algal cell disrupted with high pressure homogenization (40,000×); and (d) TEM image of an algal cell disrupted with enzymatic hydrolysis (25,000×).

