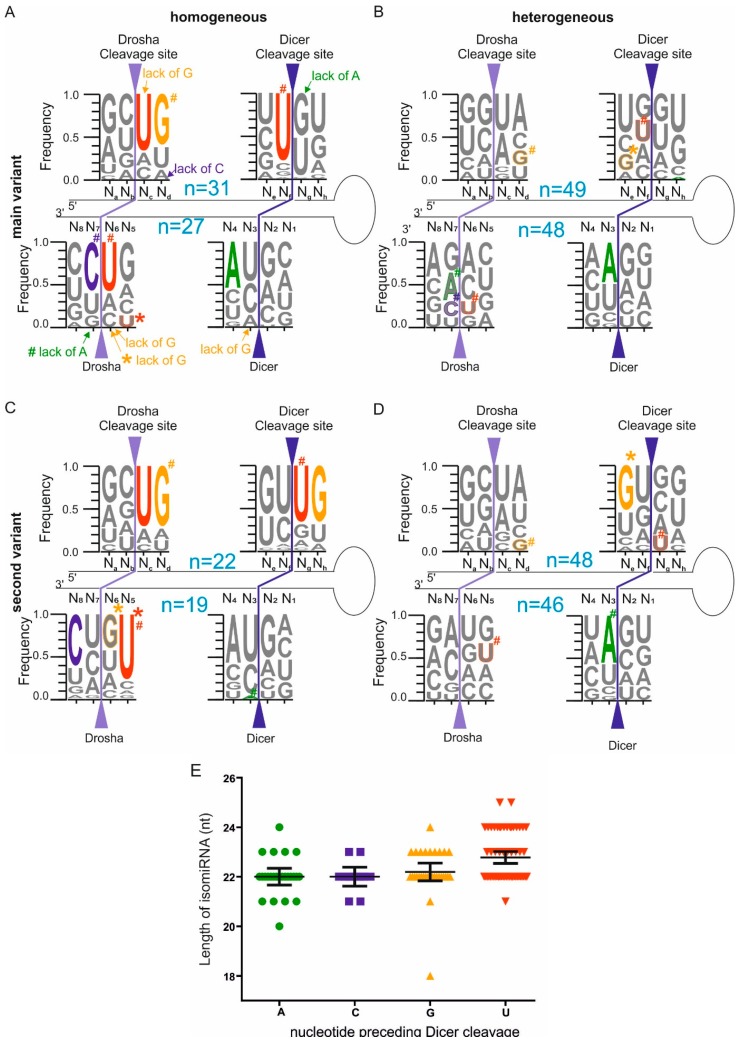
Figure 2.
The nucleotide frequencies at hairpin positions surrounding the main (A,B) and the second-most-frequent (C,D) miRNA variants among the homogenous (A,C) and heterogeneous miRNAs (B,D) are presented as WebLogo sequences. The nucleotides that are significantly different from the background (Figure 1B) are marked with solid-color letters or appropriate designations (p < 0.00078, two-sided Fisher’s exact test with the Bonferroni correction). The colored # and outlined letters correspond to nucleotides that are significantly different between the homogeneous and heterogeneous miRNA groups (Part A vs. Part B and Part C vs. Part D in Figure 2). The colored asterisk (*) and outlined letters correspond to nucleotides that are significantly different between the main- and second-most frequent miRNA variants (Part A vs. Part C and Part B vs. Part D in Figure 2). All of the statistically significant p-values are provided in Table S1. The other designations are the same as in Figure 1; (E) The distribution of the miRNA lengths based on the nucleotide specificities of the Dicer cleavages. The column scatter plot and the mean values with a 95% confidence interval are shown. The x- and y-axes denote each isomiR’s terminal nucleotide and its length, respectively. The analyzed isomiRs were derived from the 5' arm of the pre-miRNA whose 5' end was generated through homogeneous Drosha cleavage (regardless of the heterogeneity/homogeneity at the 3' end of the miRNA). Each of the colored symbols represents one isomiR (most frequent).

