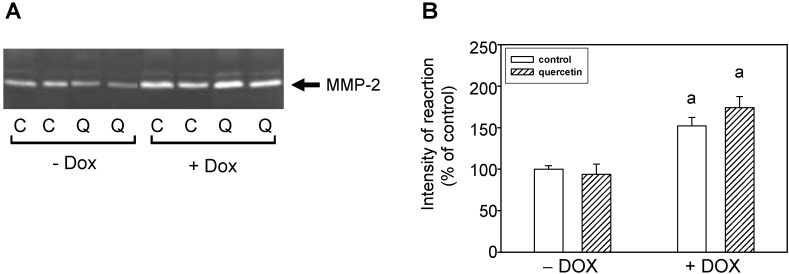
Figure 3.
Effects of QCT and DOX treatment on plasma MMP-2 activities. (A) Zymogram showing the activities of circulating plasma MMP-2 analyzed using gelatin zymography; (B) Quantitative analysis of plasma MMP-2 activities. Data are expressed as a percentage of value for corresponding control. Each bar represents mean ± S.E.M. of seven independent plasma samples per group. Statistical significance is revealed by Student’s unpaired t-test, a p < 0.05 vs. control saline-treated (−DOX) rats.

