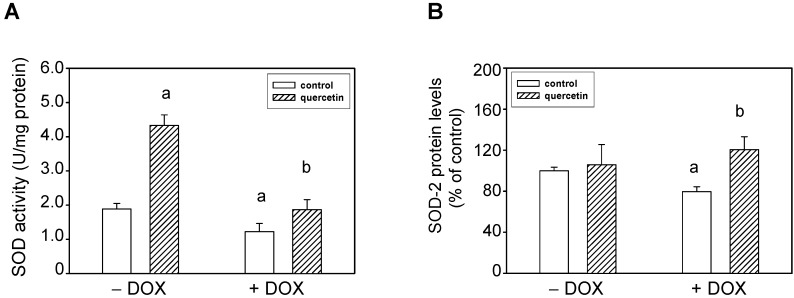
Figure 5.
Effects of QCT and DOX treatment on superoxide dismutase (SOD) total activities and protein levels. (A) The SOD activities were analyzed using the SOD Assay kit in tissue samples of the left ventricle. The specific activities are expressed in units per mg of proteins and are presented as mean ± S.E.M.; (B) Quantitative analysis of SOD-2 protein levels. Data are expressed as a percentage of value for corresponding control. Each bar represents mean ± S.E.M. of seven independent tissue samples per group. Statistical significance is revealed by Student’s unpaired t-test, a p < 0.05 vs. control saline-treated (−DOX) rats; b p < 0.05 vs. DOX-treated (+DOX) rats.

