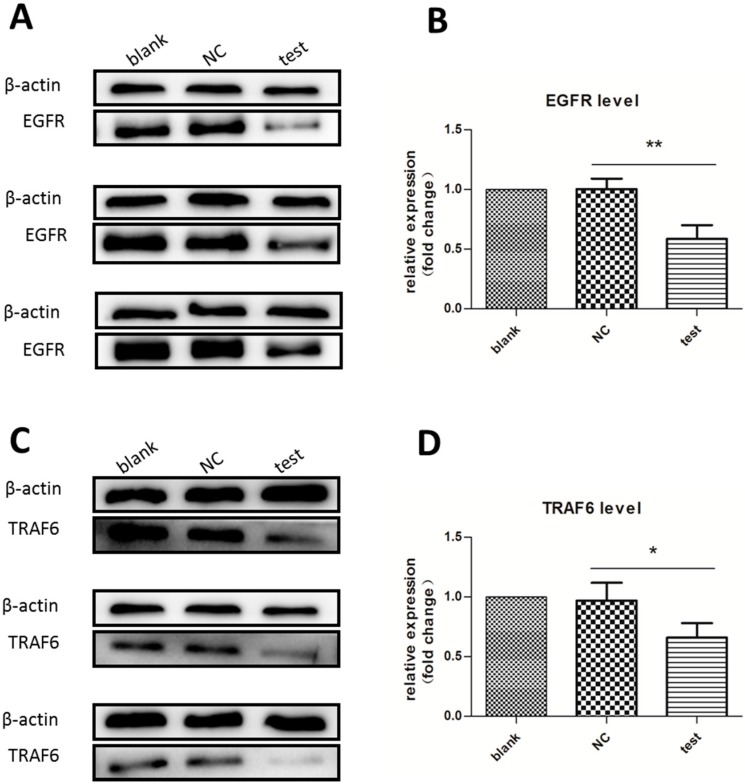
Figure 2.
Western blot analysis of EGFR and TRAF6 expression. Cells were stimulated with RANKL/M-CSF for three days and treated with 500 nM MS2-miR-146a VLPs (test group) or 500 nM MS2-miRNC VLPs (negative control group (NC)). Lysates were cleared of cellular debris, and equal concentrations of protein (30 µg) were separated via SDS-PAGE. Proteins were identified by incubating polyvinylidene fluoride (PVDF) membrane with monoclonal antibodies. β-actin was used as a loading control. (A,B) Expression level of EGFR; and (C,D) Expression level of TRAF6. * p < 0.05, ** p < 0.01. Each experiment was carried out in triplicates.

