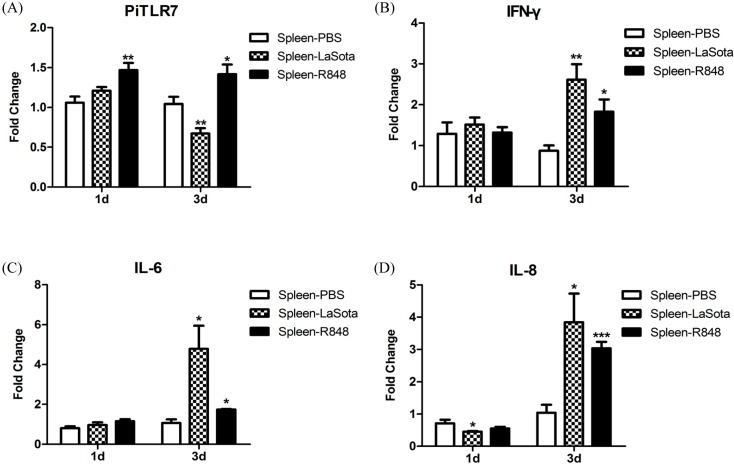
Figure 8.
Levels of TLR7 (A); IFN-γ (B); IL-6 (C); IL-8 (D); CCL5 (E); and IL-10 (F) mRNAs in spleens of pigeons following LaSota inoculation or R848 injection. King pigeons were injected in an intramuscular route either with 10 μg R848, 106 mean egg infectious dose (EID50) LaSota or phosphate-buffered saline (PBS) in 200 μL respectively. Data shown are the fold changes in mRNA expression compared with PBS control at 1 and 3 day post infection, based on six pigeons for each time and determined by qRT-PCR. Error bars indicate standard deviations of the means. Statistical significance was determined at p < 0.05 (*), p < 0.01 (**) or p < 0.001 (***).


