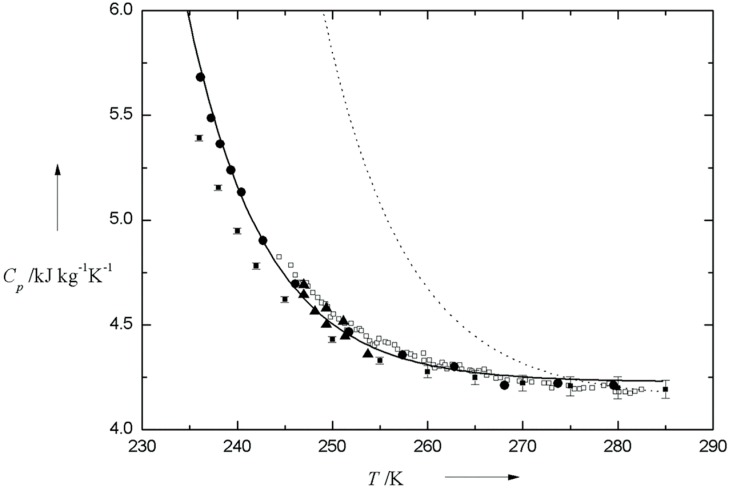
Figure 1.
Variation of Cp with temperature. Specifically, solid triangle, solid circle, solid square with error bar, hollow square are denoted as the value of Cp determined by Bertolini et al. [28], Angell et al. [20,21], Archer and Carter [29], and Tombari et al. [30], respectively. For better comparison, the solid line and dashed line, representing the simulation results from IAPWS-95 and IAPWS-84, respectively [31], are also shown.

