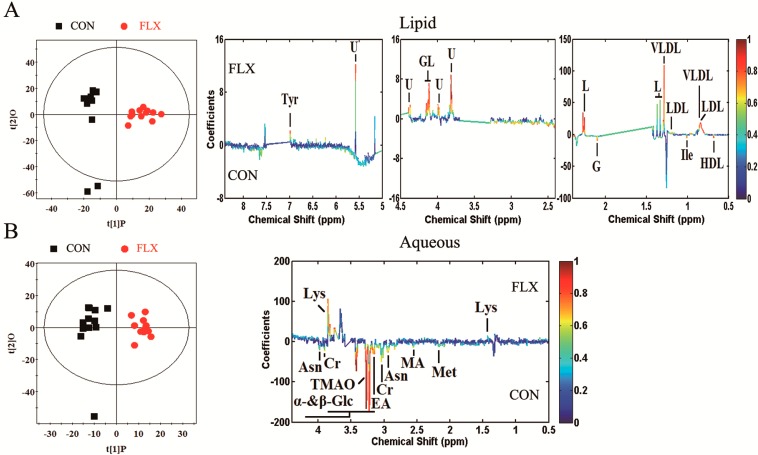
Figure 5.
Orthogonal partial least-squares discriminant analysis (OPLS-DA) score plots and corresponding coefficient loading plots. OPLS-DA score plots (left panel) and corresponding coefficient loading plots (right panel) derived from the 1H NMR spectra of the lipid phase (A) and aqueous phase (B) of cellular extracts obtained from CON and FLX. The color map shows the significance of metabolic variations between the two groups. Positive peaks indicate metabolites that are more abundant in the fluoxetine-treated group, while negative peaks indicate metabolites that are more abundant in the untreated control group.

