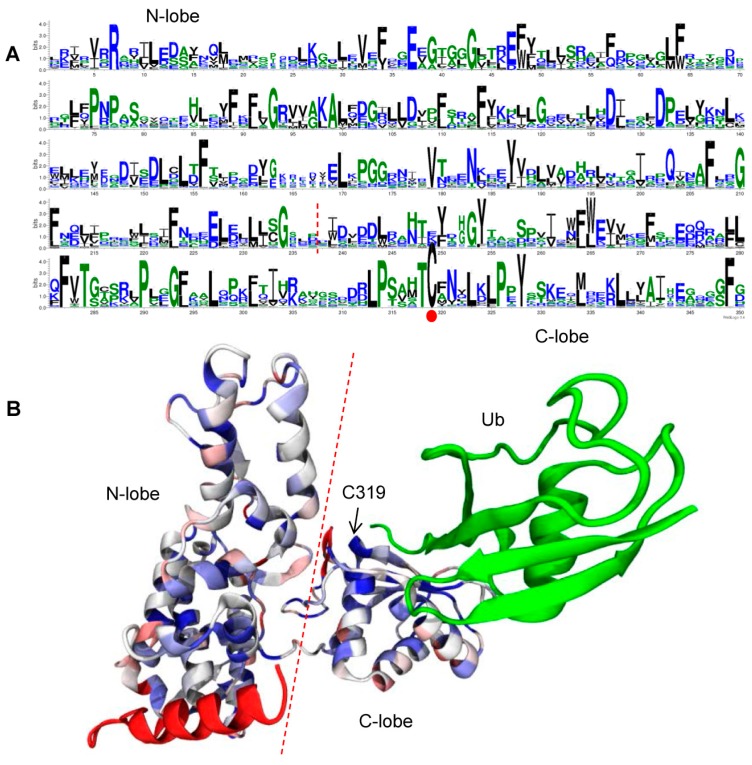
Figure 6.
Logo and 3D representations of the highly conserved residues of 365 HECT domains in plants. Bits in the y-axis (A and Figure S3) represent the amount of informational content at each sequence position; Note that in the 3D representations (B), green represents ubiquitin (Ub), and the similarity values are mapped to a color gradient from low (red) to high rate of conservation (blue).

