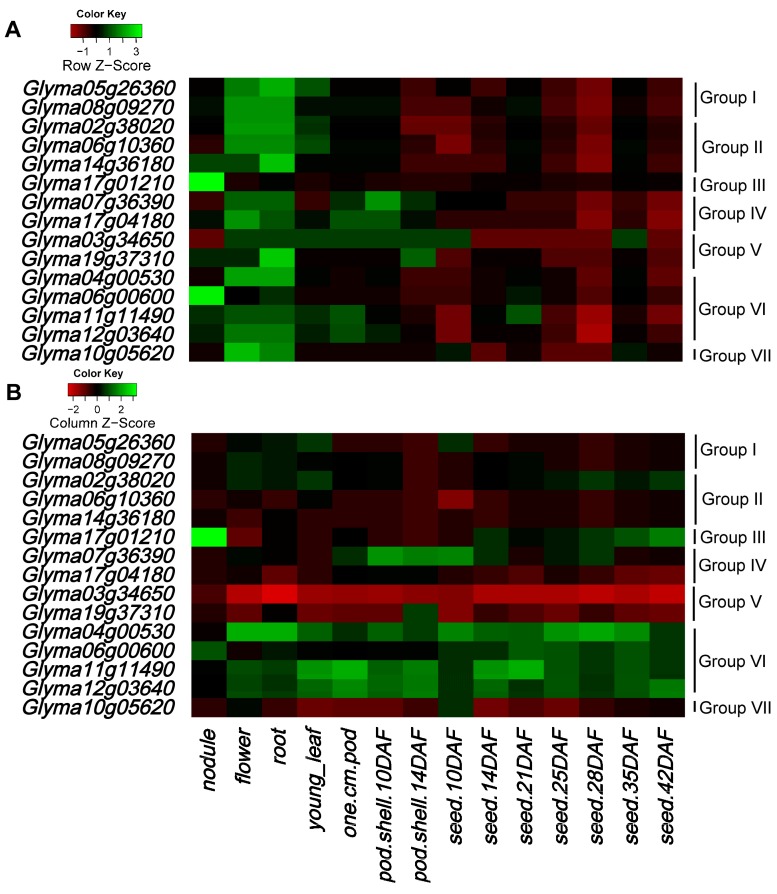
Figure 7.
Heatmap of expression profiles of soybean HECT genes in 14 tissues. Normalized transcriptional levels were obtained from Severin et al. [33]. The RNA-seq relative expression data of 14 tissues was used to reconstruct the expression patterns of soybean genes. Color in the heatmaps represents Z-score of RPKM values of soybean HECT genes calculated per row (gene) (A) and per column (tissue) (B), respectively. Z-scores calculated per row (A) were used to show the changes of expression of a gene across different tissues, and Z-scores calculated per column (B) were used to rank genes for each sample. The sources of the samples are as follows: young leaf, flower, one cm pod, pod shell 10DAF (day after flowering), pod shell 14DAF, seed 10DAF, seed 14DAF, seed 21DAF, seed 25DAF, seed 28DAF, seed 35DAF, seed 42DAF, root, and nodule.

