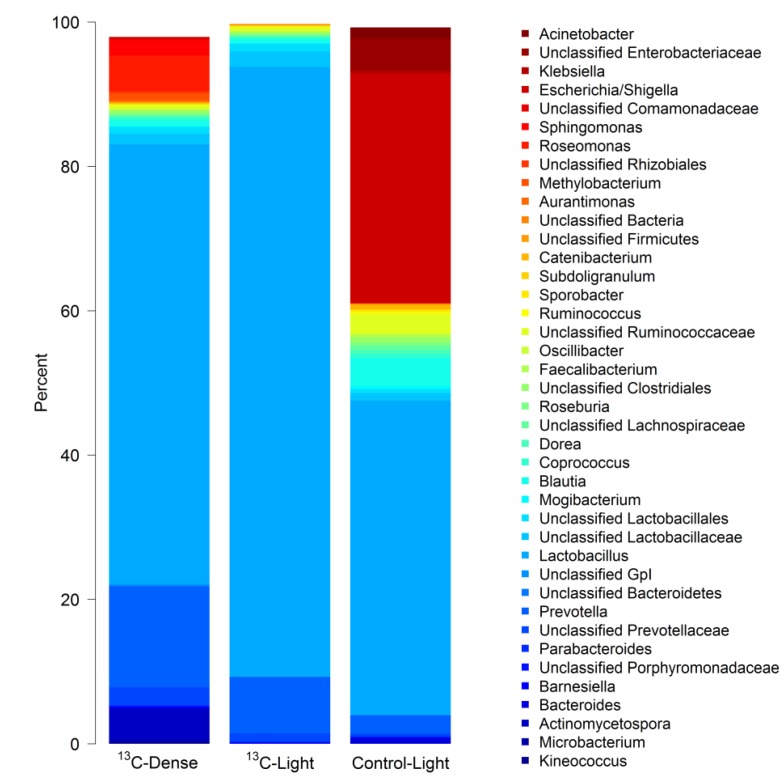
Figure 3.
Stacked barplot showing the mean genus level composition of density gradient fractions from independent cultures (3 piglets). Bars labelled 13C-Dense represent the mean composition of fractions 4–6 in cultures with 13C-sialic acid; 13C-Light represents the mean composition of fractions 12–14 in cultures with 13C-sialic acid; Control-Light represents the mean composition of fractions 12–14 in control cultures without sialic acid. The bacteria shown are the 40 taxa with the highest mean relative abundance across all samples.

