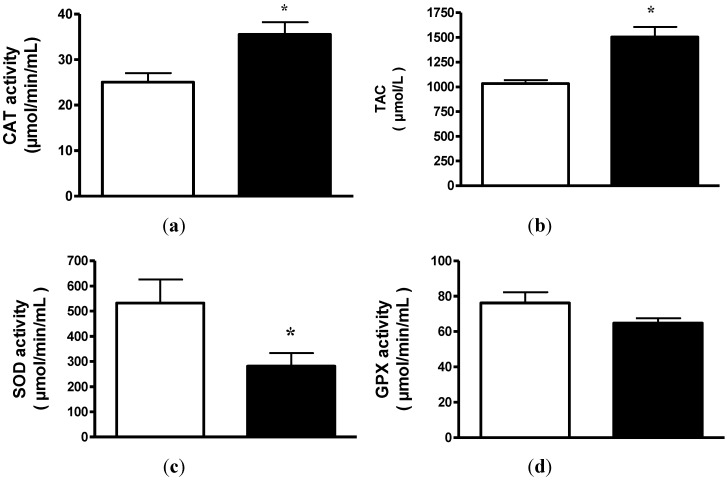
Figure 1.
(a) Plasma catalase (CAT) activity from anorexia nervosa (AN) patients before (white) and after (black) weight gain. The results are reported as the means ± SEM (n = 25),* p < 0.01; (b) Plasma total antioxidant capacity (TAC) from anorexia nervosa (AN) patients before (white) and after (black) weight gain. The results are reported as the means ± SEM (n = 25),* p < 0.01; (c) Plasma superoxide dismutase (SOD) activity from anorexia nervosa (AN) patients before (white) and after (black) weight gain. The results are reported as the means ± SEM (n = 25),*p < 0.05; (d) Plasma glutathione peroxidase (GPX) activity from anorexia nervosa (AN) patients before (white) and after (black) weight gain. The results are reported as the means ± SEM (n = 25).

