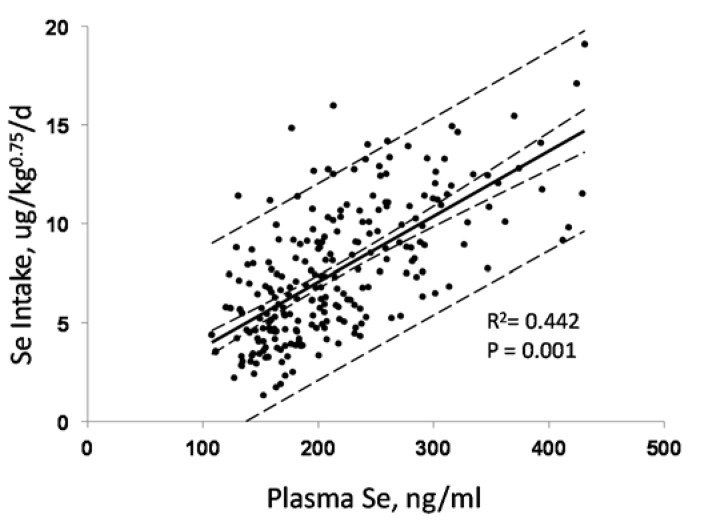
Figure 7.
Relationship of plasma Se concentration and estimated Se intake in non-deficient Americans. (Regression: Sein, μg/kg0.75/day = 0.44 + 0.03 × Seplasma, ng/mL; dotted lines indicate 95% confidence limits) Recalculated from data of Combs et al. [50].

