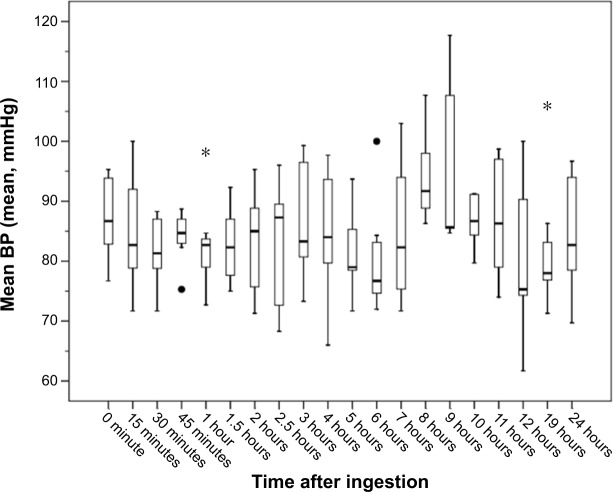
Figure 5.
Blood pressures (BP) of every subject during the day of the study.
Notes: Upper fence represents maximum value, lower fence represents minimum value, the box represents the 25th–75th percentile, the horizontal black line represents the 50th percentile (median). •Represents outlying value. *Represents extreme outlying value.

