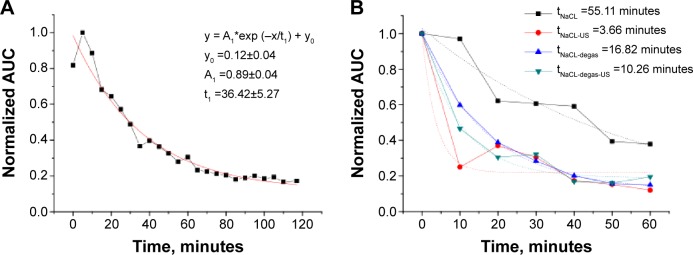
Figure 7.

Release profile of NO from the dry powder (A) and redispersed in physiological solution (B) microbubbles. Ultrasound-mediated release of NO is observed for both standard (NaCl) and degassed (NaCl-degas) physiological solutions.
Notes: Exponential function of a time y=A1*exp (-x/t1) + y0 were used to quantify the gas release. A1 represents the initial NO concentration at t=0; t1 represents mean half-time of the gas release; y0 is a plateau value that represents the remaining NO concentration at t=∞.
Abbreviations: NO, nitric oxide; AUC, area under the curve.
