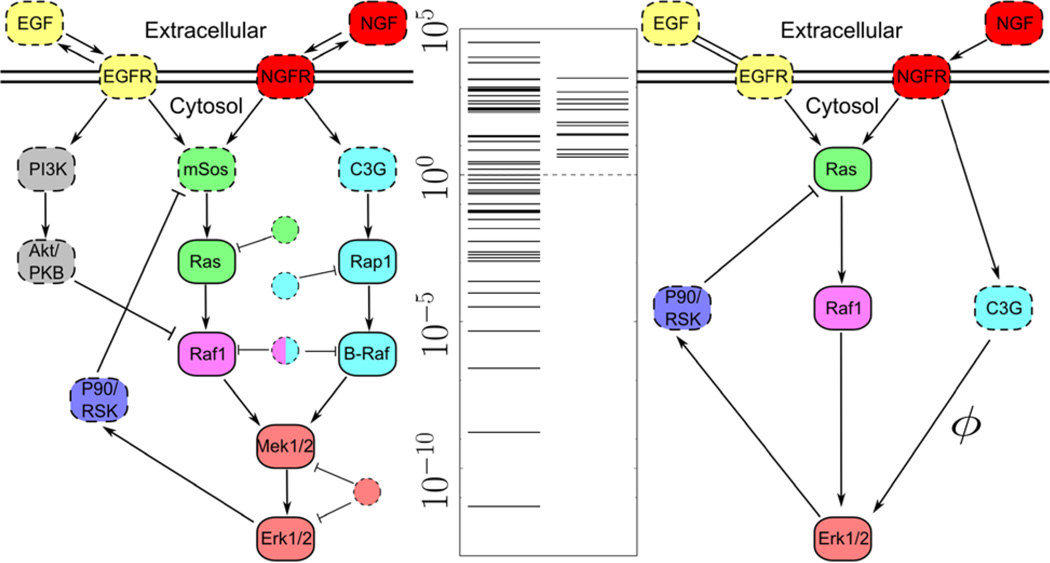
FIG. 3.
Original and reduced EGFR models. The interactions of the EGFR signaling pathway [32,33] are summarized in the leftmost network. Solid circles are chemical species for which the experimental data were available to fit. Manifold boundaries reduce the model to a form (right) capable of fitting the same data and making the same predictions as in Refs. [32,33]. The FIM eigenvalues (center) indicate that the simplified model has removed the irrelevant parameters identified as eigenvalues less than 1 (dotted line) while retaining the original model’s predictive power.

