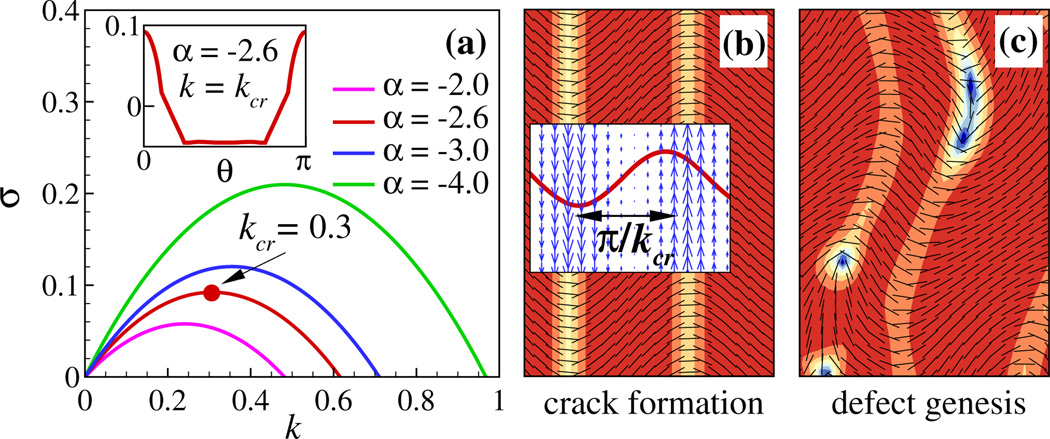
FIG. 4.
(color online). Linear stability analysis (a) and nonlinear simulation (b),(c) for strongly antialigned MTs. (a) The real part of the growth rate as a function of wave number k for several values of α (α = αaa + αpa). Here kcr corresponds to a maximum growth rate. Inset: Real part of the growth rate as a function of wave angle θ when fixing k = kcr. (b) Crack formation. Inset: The fluid velocity vector field (blue) and the eigenmode (red line) associated with kcr. (c) Genesis of defects at late times.

