Figure 4.

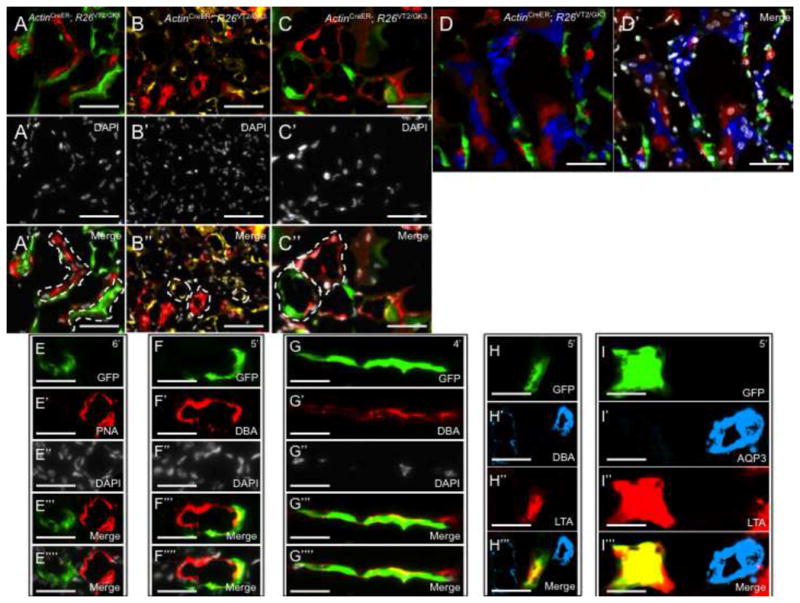
Clonal analysis of the mammalian kidney following Ischemia/Reperfusion (I.R.). (A–C) Composite Rainbow images from ActinCreER; R26VT2/GK3 mice following two months of tracing. (A-A″) Singly colored red and green clones contributing to the damaged renal cortex. (B-B″) Singly colored yellow and red clones contributing to the damaged renal medulla. (C-C″) High power image showing red and green clones contributing to the damaged collecting ducts. (D, D′). Confocal Rainbow images of the renal medulla showing clones are retained within segments following renal damage. (E–I) Singly colored clones that emerge following renal damage are fate-restricted. Clones are either completely absent (PNA+ for DT fate) or entirely express (DBA+ for CD fate) the segment-specific markers. Double immunostaining of segment-specific markers showing a green clone that is LTA+ DBA− (H) and LTA+ AQP3− (I) both representing a DT fate. PT, proximal tubule; DT, distal tubule, CD, collecting duct. Scale bar: A, C–I (50μm); B (25μm).
