
Figure 5.
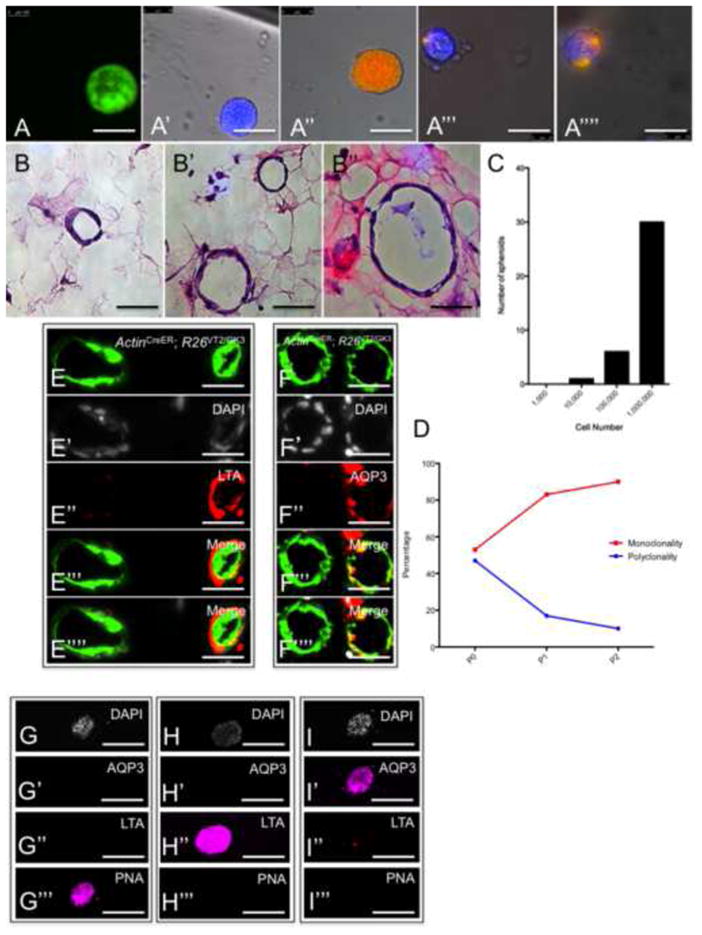
Renal spheres that develop from individual cells are lineage-restricted in-vitro. (A-A⁗) Composite fluorescent images of spheres from single cell suspensions of ActinCreER; R26VT2/GK3 kidneys. (B-B″) Representative sections of renal spheres stained with Hematoxylin and eosin. (C) Histogram that graphically represents the frequency of spheres formed from cells cultured in limited dilution. (D) Graphical representation of the frequency of monoclonal/polyclonal spheres emerging after serial passaging. Following three passages, most emerging spheres are monoclonal (red line), and not polyclonal (blue line). (E, F) Images of sections from renal spheres immunostained with antibodies to distinct renal segments reveal that each segment-specific marker stains some but not all spheres. (G–I) Immunostaining of 3 representative spheres with antibodies for segment-specific markers. Each renal sphere is fate-restricted to DTs (PNA+), PTs (LTA+) or CDs (AQP3+). PT, proximal tubule; DT, distal tubule, CD, collecting duct. Scale bar: A-A⁗, B-B″, E–I (50μm).