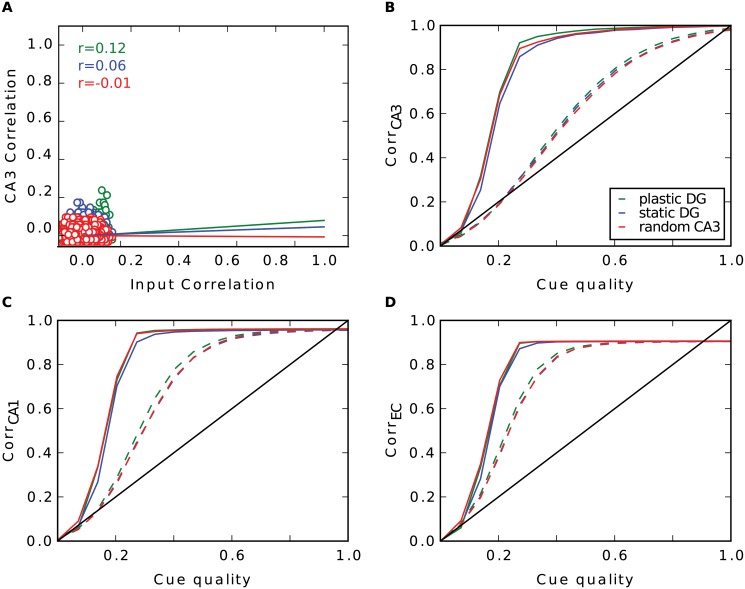
Fig 3. Pattern separation in the DG with random input.
A: Pairwise correlation between stored patterns in CA3 as a function of pairwise correlation in EC with learning in DG (green), without (blue) and when the CA3 code is set up randomly (red). Regression lines are plotted, r values are shown in the upper left. B-D: Recall performance of the different simulations in CA3 (B), CA1 (C) and EC (D). Dashed lines are simulations where the recurrent connections in CA3 have been removed.

