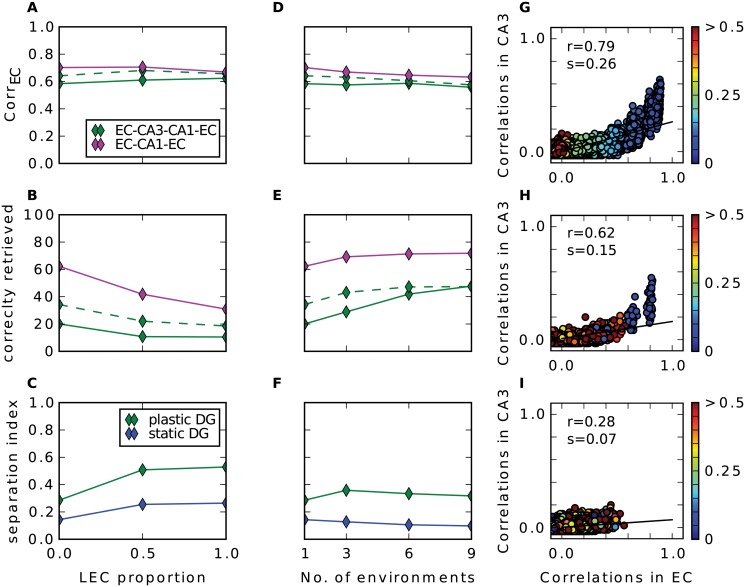
Fig 8. LEC input and multiple environments.
Results of simulations with additional LEC input (A-C) and with input from multiple environments (D-F). First row (A, D) shows the recall correlation in EC averaged over all cue strengths, second row (B, E) shows averaged proportion of correctly retrieved patterns and last row (C, F) shows pattern separation index. G: Pairwise correlation between stored patterns in CA3 as a function of pairwise correlation in EC in a simulation with only LEC inputs. Euclidean distance (in m) of the pair is indicated by the colour of disk according to the colourbar. Black line is the regression line with slope s (separation index) and r value shown in the upper left. H-I: Same as (G) in a simulation with only MEC input originating from nine different environments. H shows all pairs where both patterns come from the same map, I show all pairs where the patterns come from different maps.

