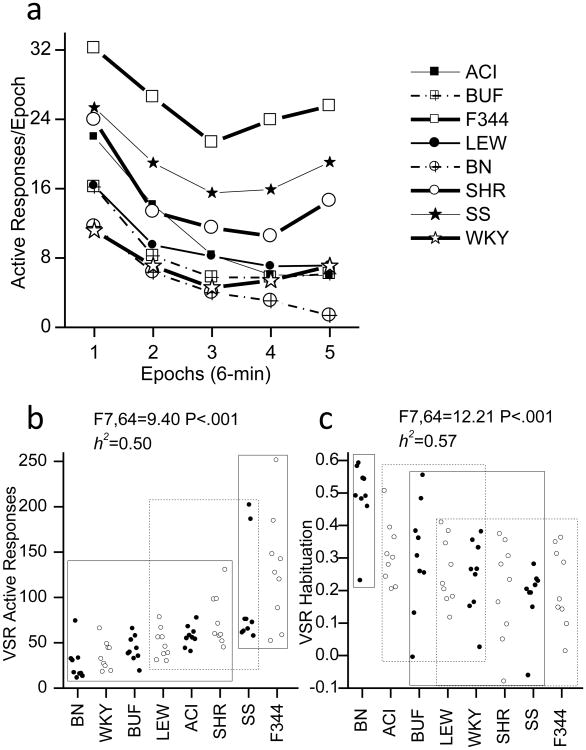
Fig 2. Sensory Reinforcement.
A) within session pattern of active responding to produce a visual stimulus reinforcer (VSR) plotted as five 6-min epochs. B) total active responses for each rat. C) degree to which active responding decreased between the first epoch of the session and the last epoch of the test session for each rat. Circles indicate the data from individual animals. The X-axis indicates strain. The rectangles in plots B and C indicate homogenous subsets as indicated by Tukey post hoc tests. The significance of the F-test for the single factor of strain and heritability (h2) are indicted.

