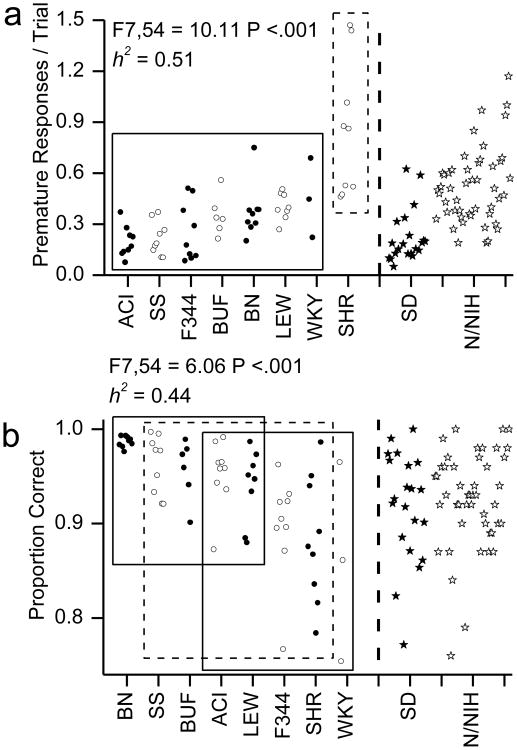
Fig 4. Choice Reaction time measures related to hyperactivity and impulsivity.
Hyperactivity/impulsivity related measures from the choice reaction time task are shown. A) Premature responses for each rat. B) The proportion of correct responses. Circles indicate the data from individual animals. The X-axis indicates strain. Values for 28 Sprague Dawley (dark stars) and 48 HS (open stars) out bred rats are shown to the right of the dashed line for comparison with the 8 inbred strains. The rectangles in plots indicate homogenous subsets as indicated by Tukey post hoc tests. The significance of the F-test for the single factor of strain and heritability (h2) are indicted.

