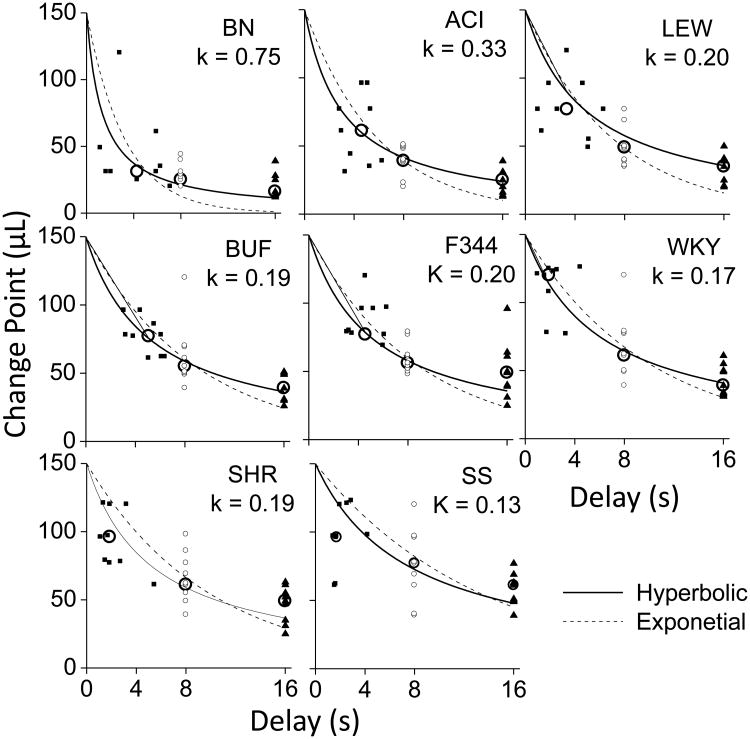
Fig 6. Best fitting hyperbolic and exponential discount functions.
Best fitting hyperbolic and exponential discount functions. Individual animal change values for each strain are shown when the programmed delays were 0, 8 and 16 s. The X-axis indicates how long it took the animal to switch between the two water sources. Solid squares indicate data for individual animals when the programmed delay was 0 s, open circles indicate data for individual data when the programmed delay was 8 s and solid triangles indicate data when the programmed delay was 16 s. Large open circles indicate median values of the for each each strain. For the 0 s delay the values vary along the X-axis indicating how long it took the animals to switch when no delay was imposed (0 s). All animals switched in less than 8 s so that the time to switch was determined by the Experimenter imposed delays of 8 and 16 s. Hyperbolic (solid lines) and exponential (dashed lines) curves were fit to the medians of the individual change values for each strain. Individual k values resulting from the hyperbolic fit are shown for each strain.

